RNA-Seq
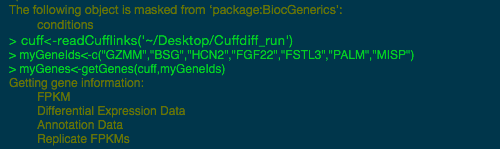
RNA-Seq experiments are bringing new understanding and knowledge to the study of protein-encoding transcripts, whether from normal tissues at different points in time or between normal and disease states.The newest member of the Sequencher plugins family is the Cufflinks suite[1], a series of programs specifically designed for the study of RNA-Seq NGS data. Getting started couldn’t be easier.
Align your RNA-Seq NGS data to a reference sequence using your favorite aligner, then take the resulting SAM or BAM file and a reference GTF file to get started with Cufflinks.
The focus is on differential expression utilizing a four step process of Cufflinks, Cuffmerge, Cuffdiff and finally display of your data as tables and plots. The Cufflinks suite command-line programs are all accessible using our easy to use graphic interface. For ultimate control, you have access to all the advanced command line functions too, by way of a simple point and click Advanced (Edit) dialog.

You can run the analysis and view the results as plots from within Sequencher. Normally, differential expression requires you to install and use the R statistical programming language from the command line.
We give you a single menu command that allows you to display results using the Volcano plot, Scatter plot and Bar chart. Each spot or bar is linked to its underlying data so you can click on a spot or bar that you find interesting and explore the results in detail.
The Cufflinks suite in Sequencher now includes Cuffquant and Cuffnorm. If you are not working on differentially expressed genes but still need normalized results, use Cuffquant and Cuffnorm after the Cufflinks step. If you need to reduce the computational load on your computer, you can use Cuffquant after the Cufflinks and Cuffmerge steps to quantify the reads in your data sets. Then, when you are ready, finish the differential analysis with Cuffdiff. You will find this step to be much faster since that part of the work has already been done.
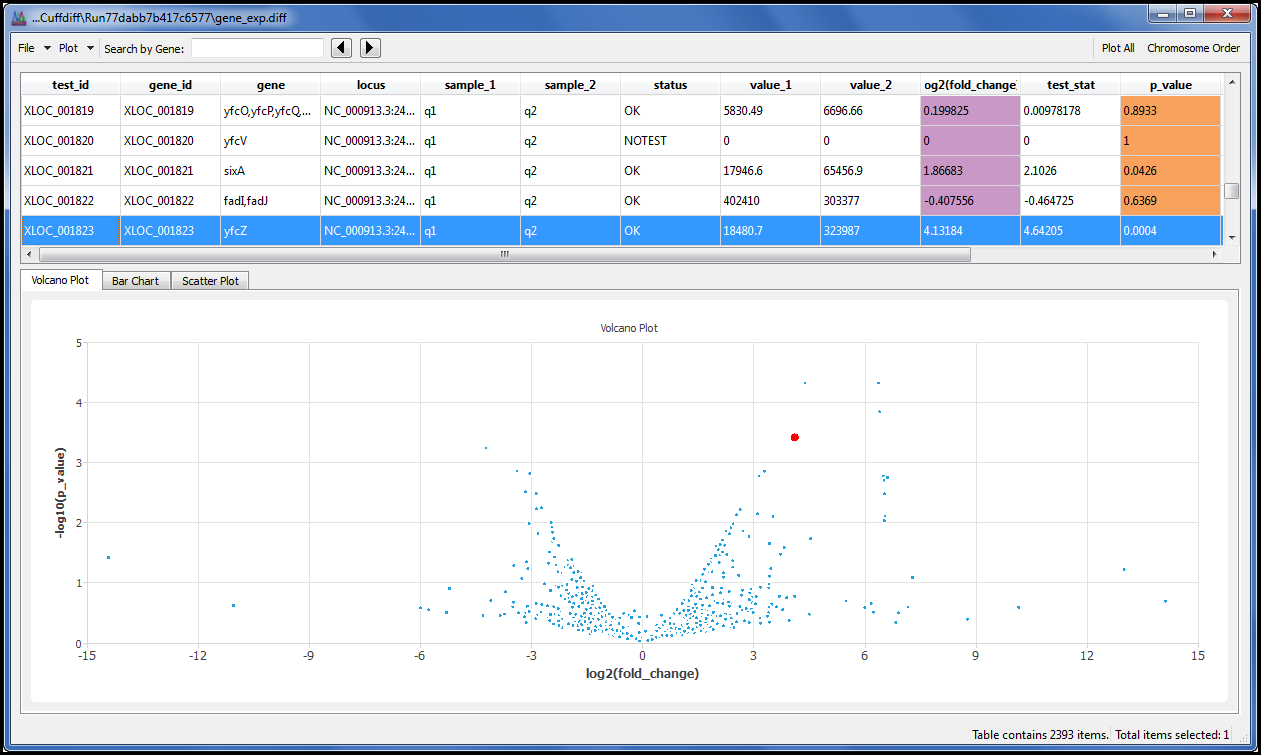

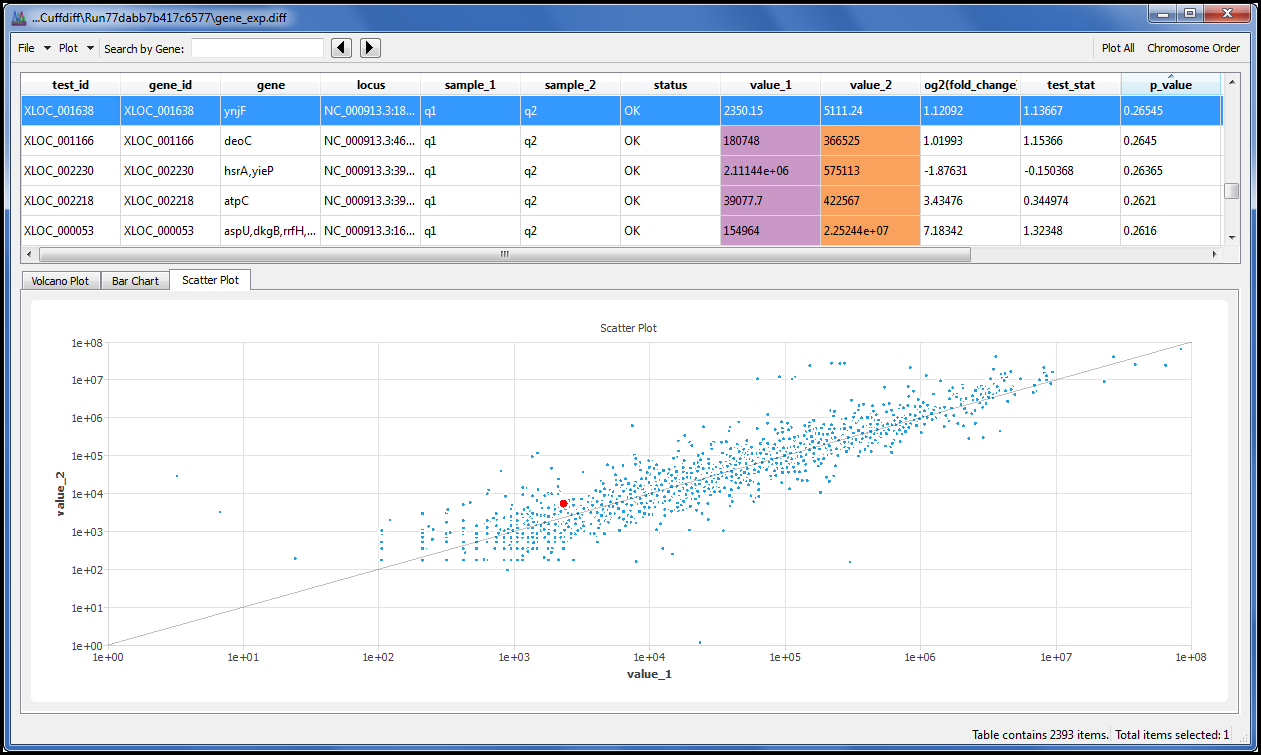
Search the data table by gene name or geneID to quickly locate your data of interest.
Sort and sift your data to plot only what you are interested in, then export the graph in PNG format for inclusion in your presentation or report.
For more information on RNA-Seq, check out the RNA-Seq Tutorial by clicking here.
[1] Transcript assembly and quantification by RNA-Seq reveals unannotated transcripts and isoform switching during cell differentiation
Cole Trapnell, Brian A Williams, Geo Pertea, Ali Mortazavi, Gordon Kwan, Marijke J van Baren, Steven L Salzberg, Barbara J Wold& Lior Pachter
Nature Biotechnology 28, 511–515 (2010)